Never install this plugin on a production instance. It is a development tool: it exposes internal hook arguments and writes a log file on every request.
What it does
HooksViewer subscribes to every event Matomo dispatches and shows you, for each request, which hooks fire, in what order, and with what arguments. It is the fastest way to find the right event to listen to when you build a Matomo plugin.
Three tools work side by side:
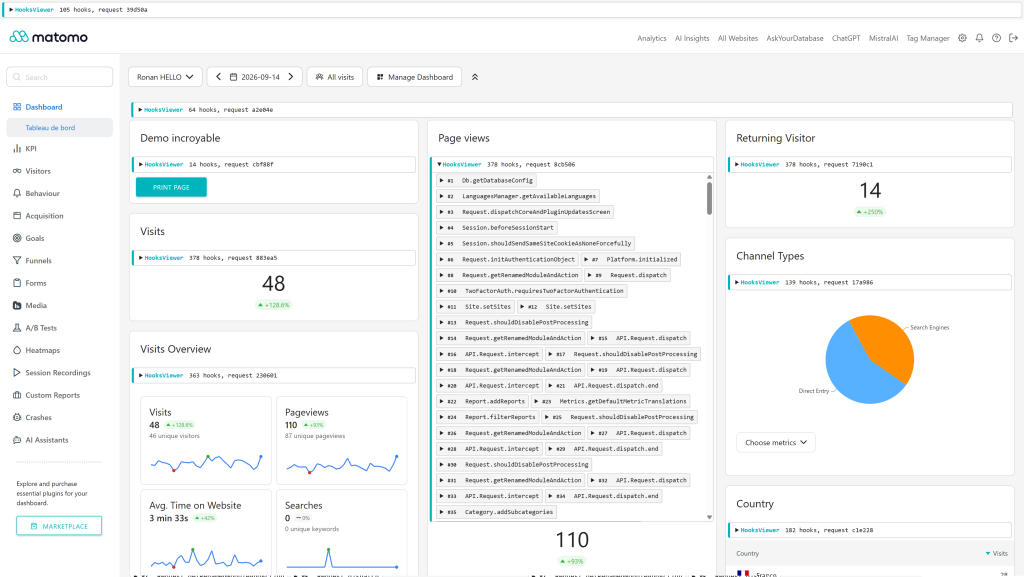
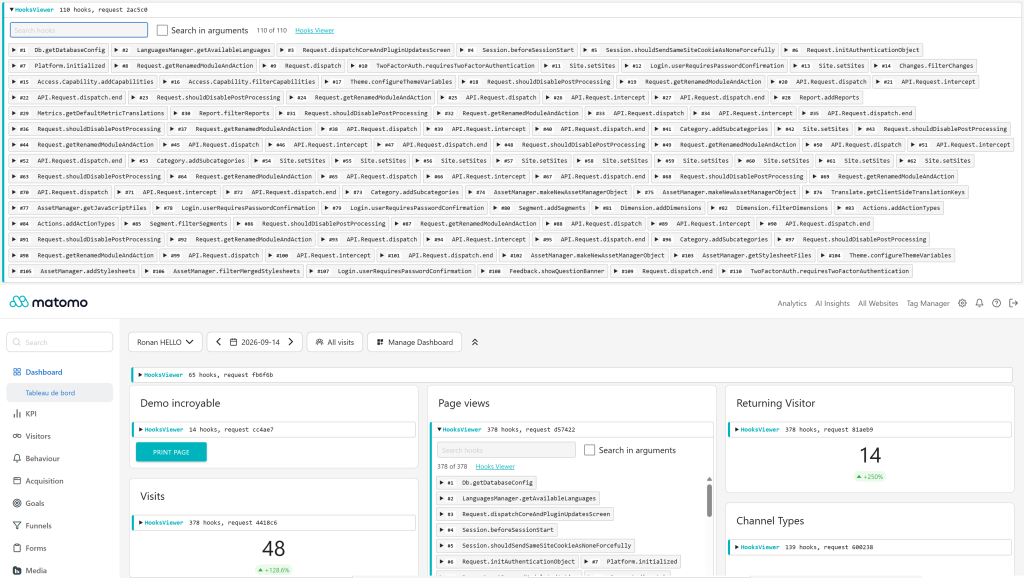
- Inline panel in the Matomo UI, for super users. Every HTML response gets a collapsible HooksViewer panel listing the hooks fired while it was built: at the top of full pages, and inside each widget or AJAX HTML fragment. Search the list by hook name, or inside the arguments, and open a hook to see a pretty-printed, multi-line dump of its arguments.
- Hook catalog under Administration → Diagnostic → Hooks Viewer.
Every known hook with its description and parameters (taken from
the docblock in the source code), the file and line where it is
posted, the plugins listening to it, and a ready-to-paste
registerEvents()snippet. Search it, filter it by category, or show only the hooks that have listeners. - Log file at
tmp/logs/hooksviewer.log. Every hook from every request, including API calls, tracker hits and console commands, is appended with a timestamp, a request id and the arguments. Watch it withtail -f tmp/logs/hooksviewer.log.
Safe for Matomo's responses
The panel is written once the response is complete, and only when that response really is HTML. JSON controllers, API calls, graph data, exports, images and tracker hits stay byte-exact, and pages keep their doctype, so the dashboard, widgets and third-party clients keep working while you explore.
How the hook list stays current
The list of subscribed events is discovered automatically by
scanning core/ and plugins/ for Piwik::postEvent('…') call sites
the first time the plugin runs, and whenever the source tree changes.
The result is cached in tmp/cache/hooksviewer-catalog.php.
You do not have to update the plugin when Matomo or a third-party plugin introduces new events: they show up the next time the cache is rebuilt.
Install
- Open the Marketplace in your Matomo admin (as a super user).
- Search for HooksViewer.
- Install, then activate.
Use
- Activate the plugin while you are exploring or debugging.
- Browse the page or trigger the workflow you care about.
- Expand the HooksViewer panel and search it, or
tail -fthe log. - Click Open in the hook catalog on any hook to read its documentation and see who listens to it.
- Deactivate the plugin when you are done.
Requirements
- Matomo 6.x
- PHP 8.1 or newer
- MySQL 8.0+ or MariaDB 10.6+
For Matomo 5, use HooksViewer 2.x.
Author
Built by Openmost. Issues and pull requests welcome at https://github.com/openmost/HooksViewer.
License
GPL v3 or later.
-
Hook detail
-
Hooks list with search bar
HooksViewer is a development tool that subscribes to every Matomo event and surfaces them while you are browsing the Matomo UI or exercising the API.
Inline panel
Every HTML response (full pages, widgets, AJAX HTML fragments) gets a collapsible HooksViewer panel, visible to super users only. Its summary shows how many hooks fired and the request id. Expand it to list the hooks in the order they fired, then expand a hook to see a clean, indented dump of its arguments.
- Full pages show the panel at the very top of the page.
- Each dashboard widget shows its own panel, so hooks like
ViewDataTable.filterViewDataTable,Visualization.beforeRenderorMetrics.isLowerValueBetterare visible for the widget that triggered them. - Type in the search field to filter the hooks by name. Every word must match. Tick Search in arguments to also search the argument dumps, e.g. to find which hook receives a given report or setting.
- Open in the hook catalog jumps to the documentation of the hook.
The panel is a Vue component. On the rare responses where Matomo does not compile Vue components (error pages, some AJAX HTML), it falls back to the plain list of hook names.
Hook catalog
Administration → Diagnostic → Hooks Viewer (super users only) lists every known hook:
- Description and parameters, taken from the docblock written right
above the
postEvent()call, which is how Matomo documents its events. - Posted in: the file and line of each call site.
- Listeners: the activated plugins subscribing to the hook in
registerEvents(), and observers declared inobservers.global. - A
registerEvents()snippet to listen to the hook from your own plugin, and a link to the developer reference.
Search by hook name, description, listener or file, filter by category
(the part before the first dot, e.g. Request), or show only the hooks
that have listeners. Hooks marked dynamic are listened to but their
name is built at runtime (like Controller.CoreHome.index), so they
are not found in the source code.
Rescan the source code rebuilds the catalog immediately.
Log file
tmp/logs/hooksviewer.log receives one line per fired
event from every request, including JSON API calls, tracker hits,
console commands, and requests made by users who cannot see the panel.
Each line carries a timestamp, a short request id (the same one as in
the panel summary), an event index, the hook name, and a compact view of
the arguments.
tail -f tmp/logs/hooksviewer.log
The log is rotated to hooksviewer.log.1 once it grows above 10 MB.
Where the hook list comes from
The plugin does not ship a hand-maintained list. On the first request
after activation it scans core/ and plugins/ for every
Piwik::postEvent('…') call site, resolves same-file constant
references, and persists the result to
tmp/cache/hooksviewer-catalog.php. The cache is invalidated whenever
the source tree changes, so new events introduced by a Matomo upgrade
or by a third-party plugin appear automatically.
Wildcard event names (those containing PHP variables or sprintf
placeholders, e.g. Controller.$module.$action) are skipped because
they cannot be subscribed to as a single static name.
Response safety
Nothing is printed while a hook fires. Matomo renders templates and widgets into nested output buffers, so markup printed at that moment would end up inside HTML attributes, graph data or JSON bodies.
Instead, hooks are collected during the request and the panel is written once the response is complete:
- only when the final
Content-Typeis HTML; - right after
<body>for full pages, so the doctype stays first; - at the top of HTML fragments.
These responses are never modified:
module=API(JSON / XML / CSV / TSV / RSS)- controller actions returning JSON (
#[JsonResponse], e.g.Dashboard.getAllDashboards) matomo.phpandpiwik.php(tracker hits and image responses)- exports, images, redirects and plain text responses
- console commands
Use the log file to observe their hooks.
Useful references
- Event guide: https://developer.matomo.org/guides/events
- Core event reference: https://developer.matomo.org/api-reference/events
Reminder
This plugin exposes internal arguments (including configuration values and visitor data) and writes a log file on every request. Never install it on a production instance.
How do I install the plugin?
It is published on the official Matomo Marketplace, like any other plugin:
- Open the administration panel as a super user.
- Go to Marketplace.
- Search for HooksViewer, install it, then activate it.
Which Matomo versions are supported?
HooksViewer 6.x runs on Matomo 6 (PHP 8.1+, MySQL 8.0+ or MariaDB 10.6+). For Matomo 5, use HooksViewer 2.x.
Why "never install in production"?
The plugin shows internal hook arguments (database configuration, visitor IPs, request parameters, etc.) and writes a log file on every request. Both are useful while debugging and unacceptable in production.
Where do I see the hooks?
Two places, at the same time:
- In the HooksViewer panel, at the top of each page and inside each widget. Expand it to list the hooks, expand a hook to read its arguments.
- In the log file at
tmp/logs/hooksviewer.log. This catches every hook from every request, including JSON API calls, tracker hits and console commands, where the plugin never adds any markup. Tail it withtail -f tmp/logs/hooksviewer.log.
Who can see the panel?
Only super users, and only super users can open the hook catalog. Everyone else browses Matomo normally, but the hooks of their requests are still written to the log file.
How do I find the right hook for my plugin?
- Browse the page where you want to act, expand the HooksViewer panel and search it. Tick Search in arguments to find the hook that receives the data you want to change.
- Click Open in the hook catalog to read the hook description and
parameters, see which plugins already listen to it, and copy the
registerEvents()snippet.
Where is the hook catalog?
Administration → Diagnostic → Hooks Viewer. It lists every hook found in the source code with its description, parameters, call sites and listeners, plus the hooks only known through their listeners.
Why is the panel at the top of the page and not where the hook fired?
Printing markup at the exact moment a hook fires broke Matomo: it ended up inside HTML attributes, graph data and JSON responses, and before the page doctype. The panel is now written once the response is complete. The hooks are still listed in the exact order they fired, and each widget gets its own panel.
I activated the plugin but the panel looks unstyled.
Matomo caches the merged stylesheet bundle on disk. The plugin clears that cache on activation. If you somehow get out of sync, deactivate the plugin and reactivate it: the next request rebuilds the bundle.
How does the plugin keep up with new Matomo events?
The list of subscribed hooks is not hand-maintained. The plugin
scans core/ and plugins/ for Piwik::postEvent('…') calls and
caches the discovered list under tmp/cache/. The cache is rebuilt
whenever the source tree changes, so new events appear automatically.
Does the plugin break Matomo's API or tracker?
No. The panel is only added to HTML responses. API responses, JSON controller actions, CSV exports, XML, images, redirects and tracker hits are left untouched. Use the log file to observe hooks fired during those requests.
Some hooks I expected to see are missing.
A few things to check:
- Is the event a wildcard (e.g.
Controller.$module.$action)? Those are skipped because they have no fixed name to subscribe to. - Did the event fire at all on this request? Check
tmp/logs/hooksviewer.log: if it's not there either, the code path was not reached. - Was the hook fired during a JSON or API request? No panel is added to those, check the log file.
- Does the panel say "more in tmp/logs/hooksviewer.log"? A single response keeps at most 5,000 hooks in its panel, the rest is in the log.
Will the log file fill my disk?
No. It is rotated to hooksviewer.log.1 once it grows above 10 MB, so
at most about 20 MB are kept.
How can I contribute?
Open an issue or a pull request on https://github.com/openmost/HooksViewer.
How long will it be maintained?
As long as I keep using Matomo across projects, which is the foreseeable future. I'm the first user of this plugin: if it breaks on a Matomo upgrade I'll see it before you do.
Version
6.1.0
License
GPL v3+
Keywords
viewer, hooks, event, events, dev
Last Updated
Sep 15th 2026
Requirements
Matomo >=6.0.0-b1,<7.0.0-b1
PHP >=8.1.0
Matomo 5.x, Matomo 6.x
Downloads
7387
Changelog
Authors
Websites
Activity
10 commits (last commit 3 hours ago)
Developer
Support
ronan@openmost.com
View and download this plugin for a specific Matomo version:
- Matomo 5.x
- Matomo 6.x (currently selected)