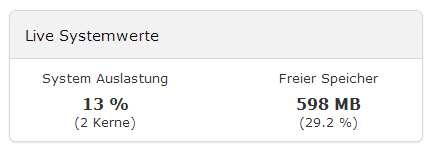
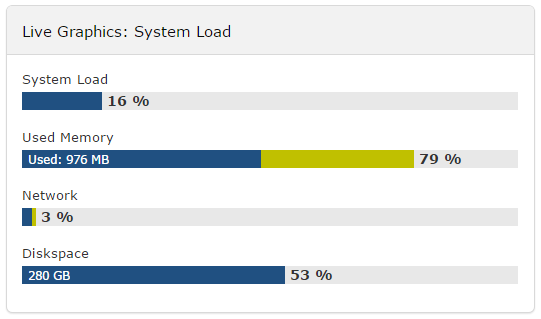
This plugin shows how much load your webserver does have, where Matomo (Piwik) (and maybe your main website) is running. Additionally the free or the used memory will be displayed.
The display will be refreshed automatically as often as you like. This can be setup by yourself in the plugin settings.
How is the CPU load calculated? For the CPU load the PHP function sys_getloadavg() is used and divided by the number of cores.
Why is there a difference between free and used memory? There are three "memory parts" under Linux:
- Used memory
- Cache
- Free memory
The sum of these three parts will be equal to the total memory. But only used memory and free memory are available as options (in settings).
What is the value for 100% network traffic You can setup the value for the maximum network traffic in the plugin system settings. The value there must be specified in kB/s (kilobyte per second). This value is used as 100% network traffic.
Does the plugin work on a shared webspace? In the most cases a shared webspace doesn't have access to system information. Therefore in these cases, the plugin cannot be used. The pseudo file system /proc must be accessible.
Does the plugin work on Windows system? If the server where Matomo (Piwik) is running is using Windows as OS, the plugin doesn't work yet. If just your browser is running under Windows (and the server runs under Linux) this plugin works well.


