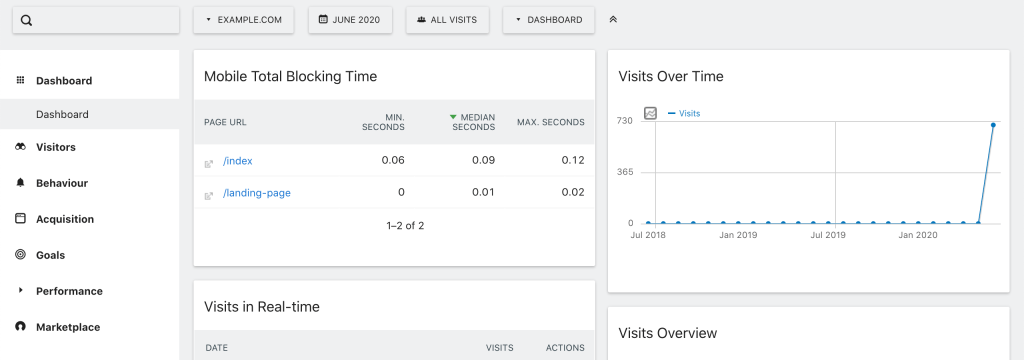
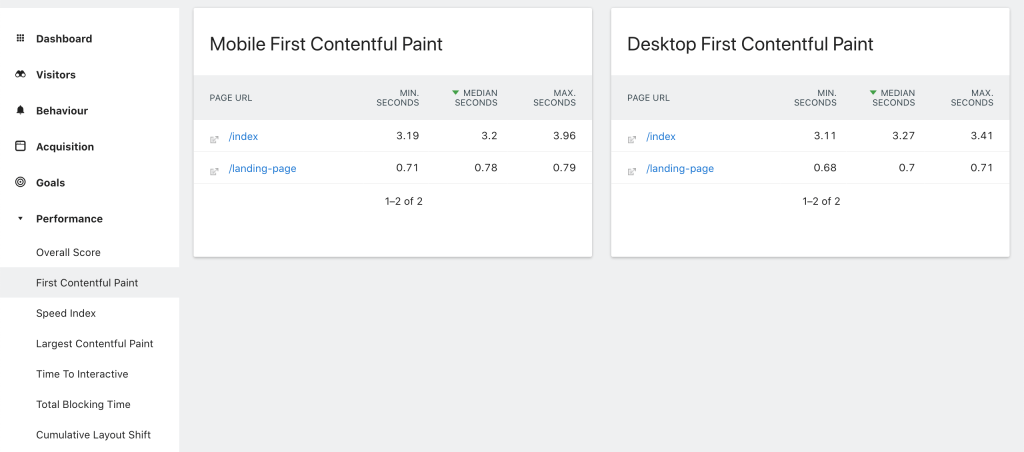
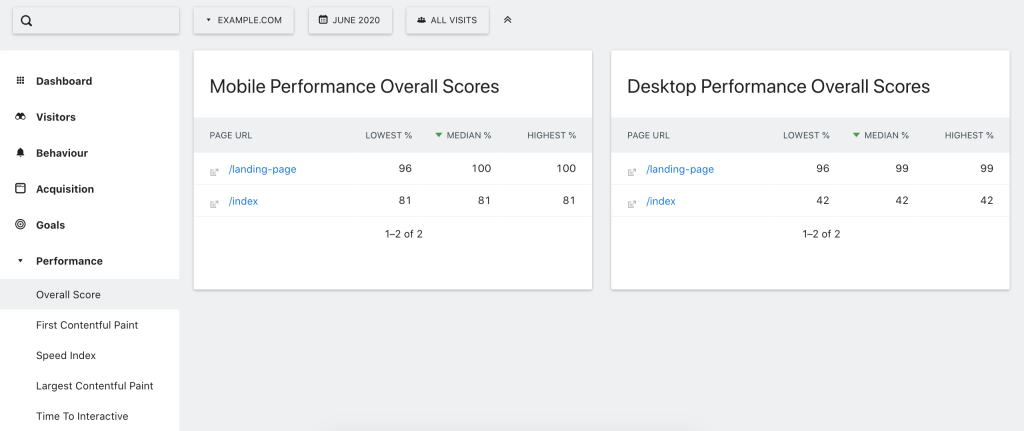
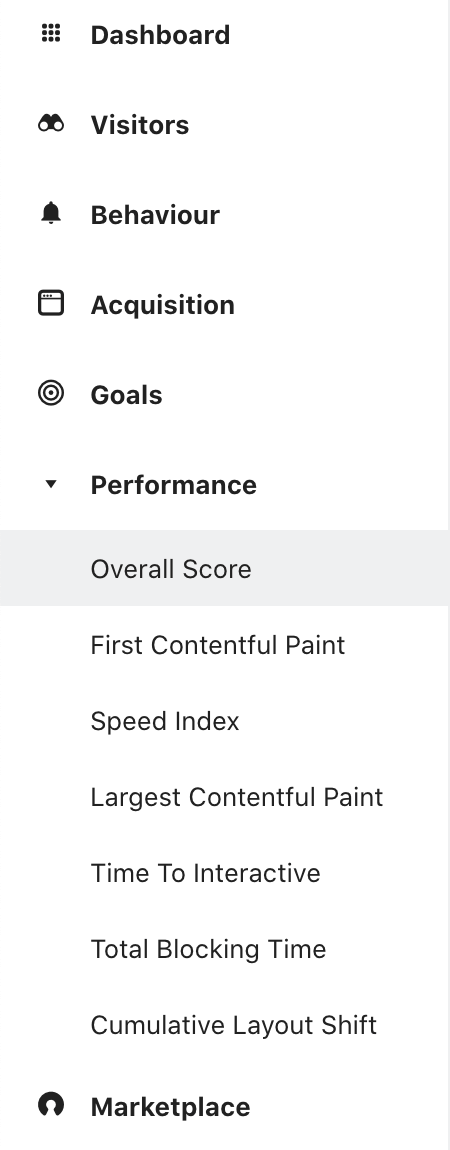
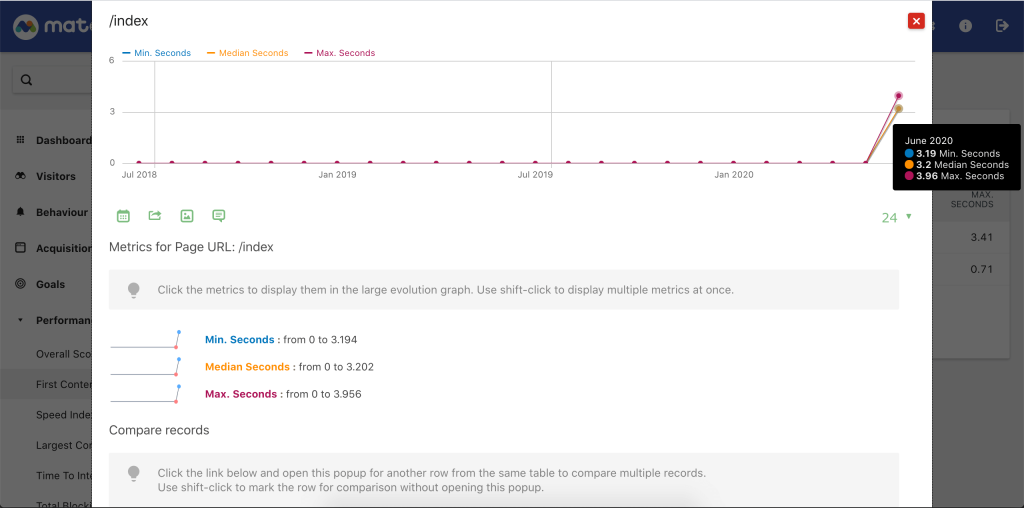
Daily performance audits of all your sites in Matomo for the following metrics based on Google Lighthouse: - First Contentful Paint - Speed Index - Largest Contentful Paint - Time To Interactive - Total Blocking Time - Cumulative Layout Shift - Overall Score
Continuously monitor those Web Vital metrics over time, allowing detection of underlying problems before they have an adverse effect for users or simply track changes made to the web application, allowing you to establish a baseline for comparison too.
Note: Requires minimum NPM v10.x (part of Node.js 20.x LTS) to be installed on your server, otherwise plugin cannot be activated.
View and download this plugin for a specific Matomo version:
- Matomo 4.x
- Matomo 5.x (currently selected)
How are the audits generated? Are any external services used?
The audits are generated using Node.js in the background by running Googles Lighthouse tool against all the visited/tracked pages within the last 30 days. Everything is executed locally on your server, no data is transferred to external services.
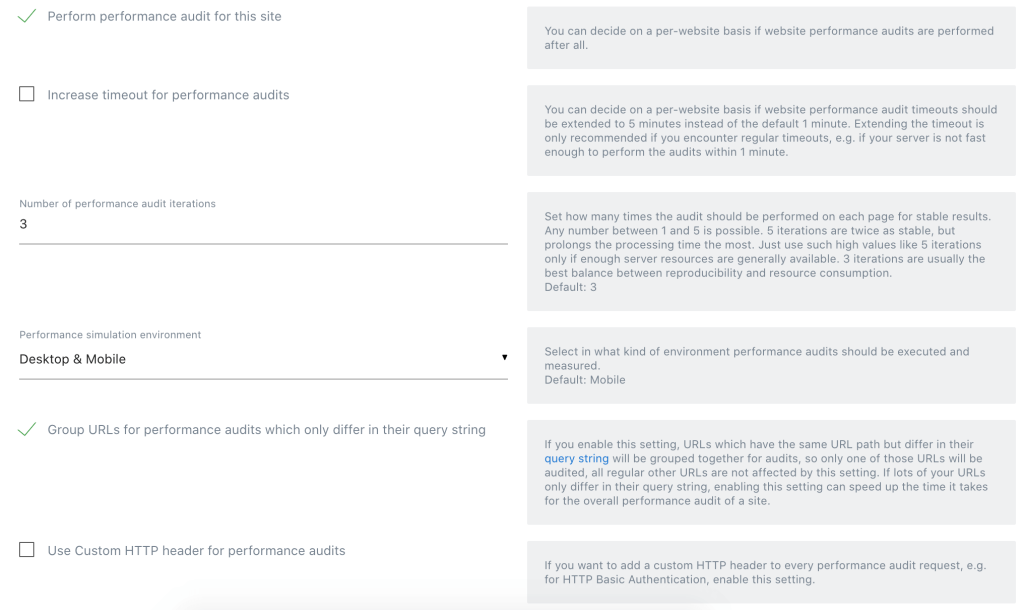
How do I change to audit only mobile or only desktop environments of my site?
Under General Settings > Websites > Manage click on the edit button of the site you want to change the setting of and scroll to the setting Performance simulation environment selection to change it.
I just installed the plugin or I just switched the website settings of the performance simulation environment and I cannot see any performance reports, why is that?
You need to wait at least 24h until the reports are getting generated in the background with the scheduled tasks of your Matomo cron job.
I shutdown/restarted my server and now the performance reports won't get generated anymore, what can I do?
If the site audit gets unexpectedly interrupted, so the plugin can't properly finish its code execution it will have a problem to restart. It would be possible to automatically fix this problematic state, but very long running site audits would run into issues then. So in this case you either wait until the next week starts (an internal plugin reset will happen then), or you can run the Matomo console command console performanceaudit:clear-task-running-flag which will reset the plugin state, so the audits will be scheduled correctly again at the next possible time.
I want to use a custom HTTP header for authentication, so the audit plugin can access my protected pages, how do I do that?
Under General Settings > Websites > Manage click on the edit button of the site you want to change the setting of and scroll to the checkbox Use Custom HTTP header and activate it in order to change the HTTP header key and its value. The audit tool will send then the entered header value paired with the selected header key to the server with every request.
The plugin cannot install because Chromium cannot be installed due to a missing library?
Make sure all necessary dependencies for Chromium are installed.
-
Dashboard
-
FirstContentfulPaint
-
OverallScores
-
PerformanceSubcategories
-
TimelineFirstContentfulPaint
-
WebsiteSettings
View and download this plugin for a specific Matomo version:
- Matomo 4.x
- Matomo 5.x (currently selected)